How innovation and collaboration are improving air quality in Eindhoven
Clean air is a social responsibility that can only be effectively improved through collaboration. That’s why the Municipality of Eindhoven has developed the finely-meshed Innovative Air Monitoring Network (Innovatief Luchtmeetnet or ILM) together with TNO and others. Policymakers, the general public, and knowledge institutions are joining forces for a unique approach that will lead to effective measures and improve health in the region. What has been achieved so far?
‘Air quality concerns us all, but no one feels responsible for it.’ Henri van der Velden, Advisor on Healthy Urbanisation at the Municipality of Eindhoven, knows from experience that tackling air pollution is a complex challenge. He shows a 2004 satellite map of western Europe showing the southern Netherlands, Belgium, and the Ruhr Area coloured dark red by high concentrations of nitrogen dioxide.
‘This map has caused a lot of excitement and unrest among politicians and the general public. It shows particularly well that air pollution doesn’t care about national or municipal boundaries. That doesn't mean there isn't anything to be done about it. Air pollution is composed of several layers. In addition to the higher, country-wide, and regional layers, there are local peaks: along busy roads, near industries or airports. We can influence these peaks, we can flatten them with measures.’
Working with the general public
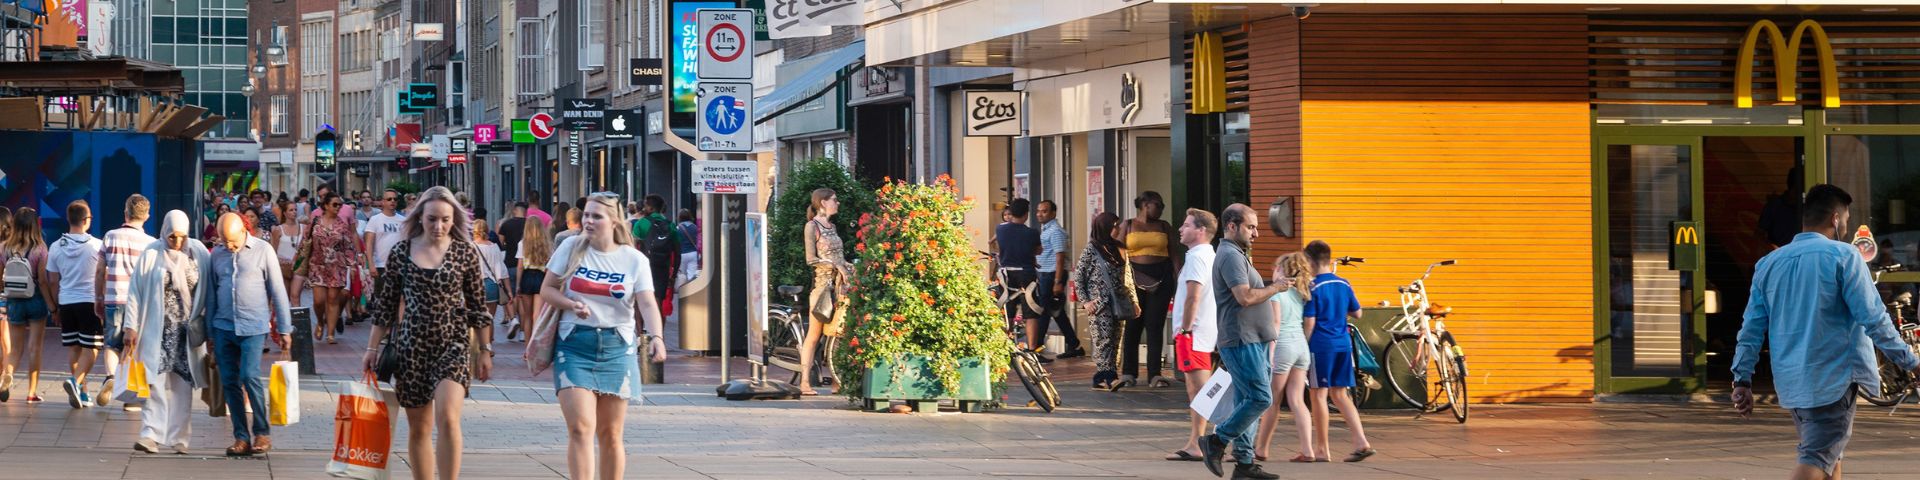
The Brainport region has an above-average and complex air quality challenge, Henri van der Velden explains. ‘We’re facing rapid growth and the need for densification in the city. Around Eindhoven, there are major national roads, there’s a lot of economic activity with industry, in the rural areas we find many livestock farms that emit nitrogen, and we have a large regional airport.’
One positive consequence of the now infamous satellite map is the creation of AiREAS, a citizens' initiative that promotes collaboration between the general public and public authorities for a healthy living environment. It prompted the Municipality of Eindhoven to set up a consortium including AiREAS, the Province of North Brabant, the municipal health service (GGD), the Dutch Institute for Public Health and the Environment (RIVM), and TNO. ‘Our goal was threefold: to understand local air quality; to foster collaboration between policymakers, the general public, and science; and ultimately to arrive at widely supported measures.’
‘Our regional Air Monitoring Network allows us to determine our own required reduction, which makes policy much easier to explain’
Three measurement layers
For this scientific approach, the municipality sought collaboration with TNO. ‘As an innovative region, we obviously want to be at the forefront – we owe it to our city. TNO has the knowledge and experience to build a regional monitoring network and there a link based on the lines of knowledge with this region has already been established. Moreover, TNO is in a unique position, thanks to its independent scientific position and extensive experience in working with public authorities.’
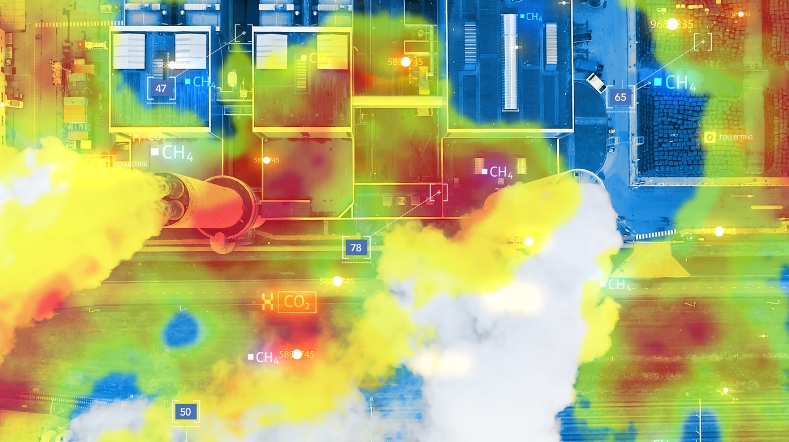
The 'Innovative Air Monitoring Network' consists of three levels, Henri van der Velden explains. ‘The base consists of three national measurement units from RIVM, supplemented by 50 measurement units from TNO, that measure nitrogen dioxide and particulate matter in real time. They’re located at various spots around the city, as well as in the rural area near livestock farms and around the airport to map out peaks. As a third layer of measurement, we've added measurements from residents. These results are often less reliable, but we can validate them with our professional monitoring devices. This metric underpinning and the involvement of the general public help us enormously to gain support, so that we can direct our energy in the same direction to take steps together.’
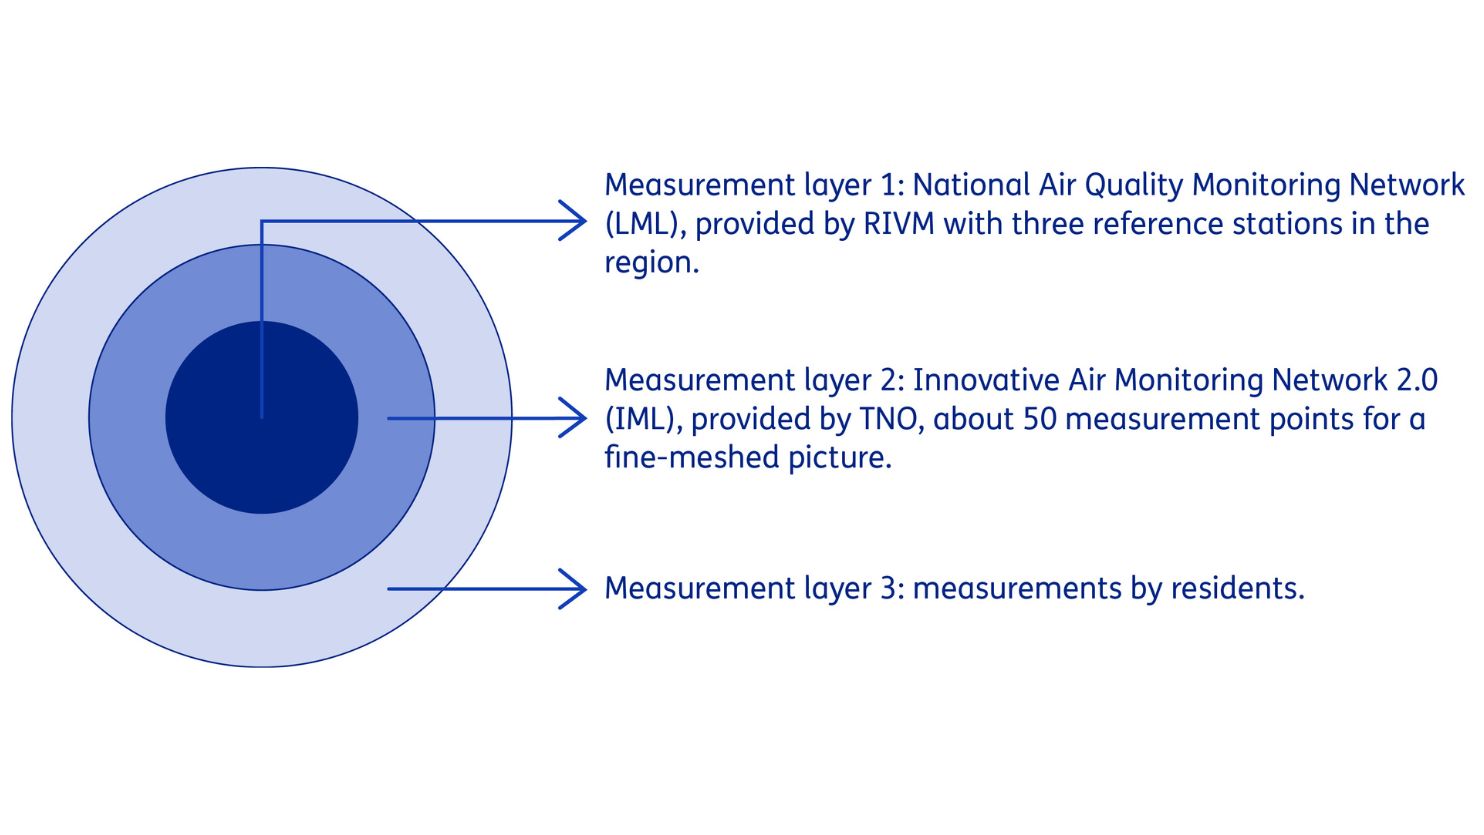
The air monitoring network consists of 3 levels. Measurement layer 1: National Air Quality Monitoring Network (LML), provided by RIVM with three reference stations in the region. Measurement layer 2: Innovative Air Monitoring Network 2.0 (IML), provided by TNO, about 50 measurement points for a fine-meshed picture. Measurement layer 3: measurements by residents.
Credible policy
The Air Monitoring Network is continuously being improved and expanded. For example, the 2.0 version gives a good and differentiated picture of air quality in the whole of southeast Brabant, including the 21 participating municipalities. Research is also under way within Eindhoven Engine, together with Zicht op Data and Fontys, on how exposure to particulate matter can be made transparent. This takes into account the movements of residents and crowding in certain areas of the city, so that the health impact can also be determined more accurately.
The detailed results of the Air Monitoring Network provide an adequate policy rationale for the Clean Air Agreement. In this national agreement, the national government, provinces, and a large number of municipalities strive for health gains of at least 50% by 2030 compared to 2016. Henri van der Velden: ‘Our regional Air Monitoring Network allows us to determine our own required reduction, which makes policy much easier to explain. It makes it easier to take responsibility and makes policy more credible to all audiences.’
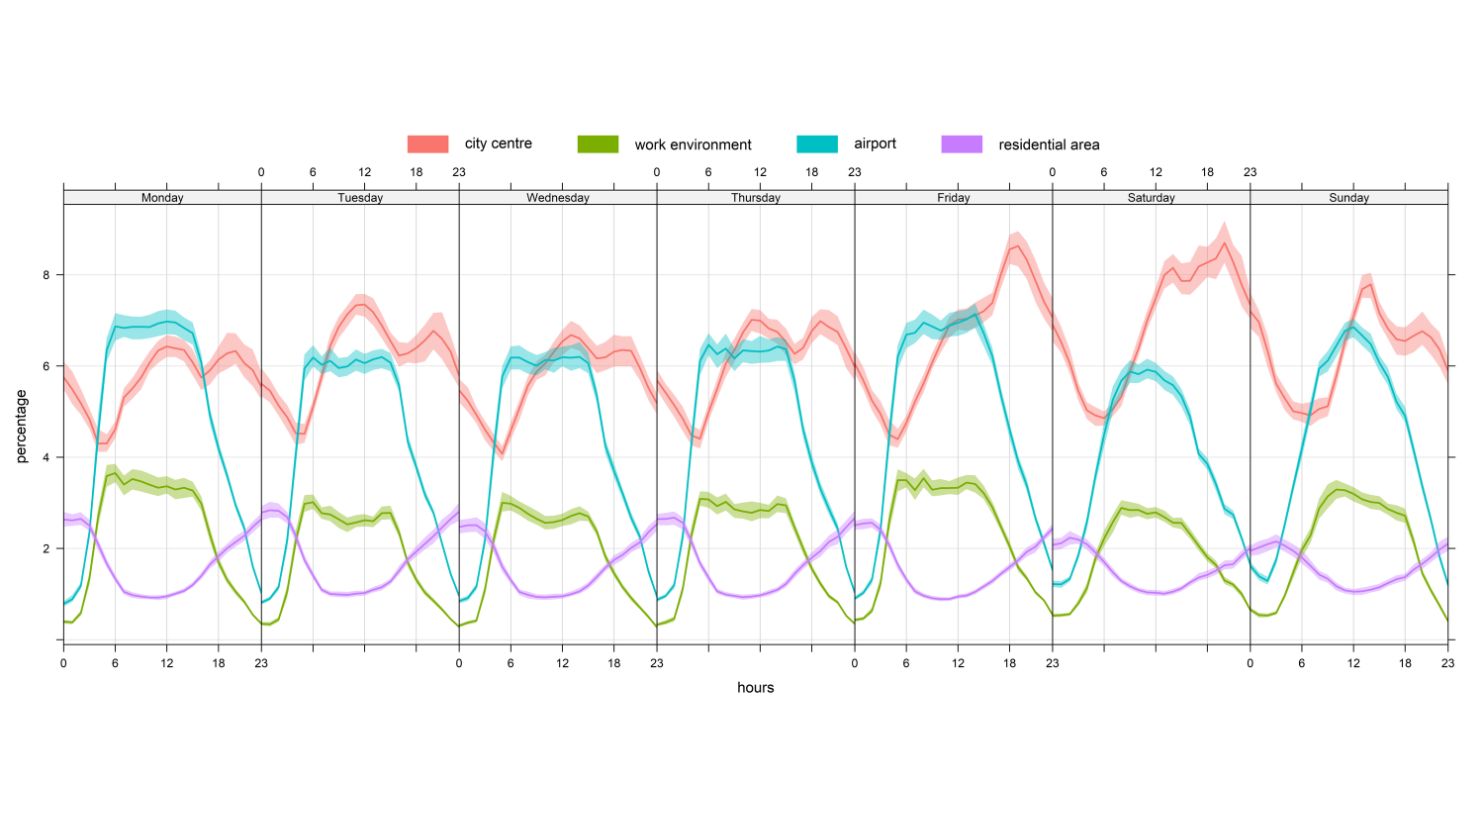
Through anonymised mobile data, we track how many people are in different places in Eindhoven during the day. Together with source apportionment, this gives insight into where and when people are exposed to polluted air. The graph above shows how people move around in 4 different places in Eindhoven (city centre, work environment, airport & residential area). For instance, we see a peak on Friday and Saturday evenings in the city centre. You can also see that residential and work environments alternate. (source: Zicht op Data)
Want to know more?
Discover more about how the collaboration and unique approach for an Air Monitoring Network in Eindhoven came about.
Concrete policies
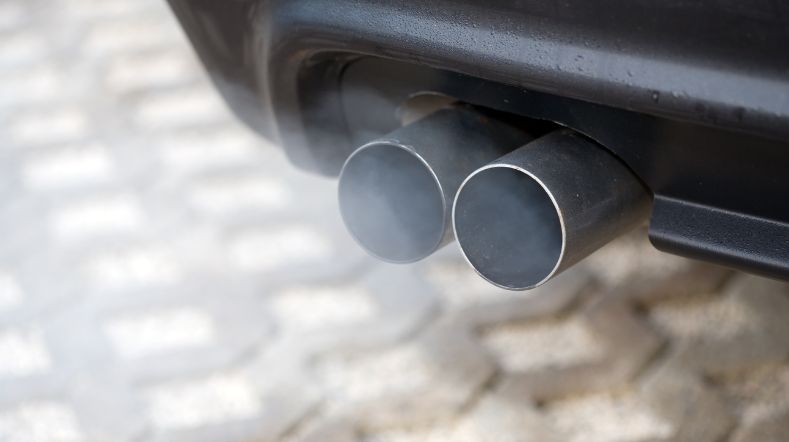
Meanwhile, the monitoring network has led to concrete policy measures, says Henri van der Velden. ‘We discovered quite quickly that traffic is one of the biggest sources of pollution in the city. We then looked at targeted traffic measures. This has led to a redesign of the central connecting road through the centre, complemented by additional traffic flow measures and more space for public and sustainable transport.’
Emissions around the airport were also addressed. ‘By improving public transport connections and access towards the ring road, not only has mobility-related air quality improved, but also accessibility.’
To smooth out the peaks as a result of industry, the municipality is issuing more stringent permits based on best available techniques (BAT). ‘In doing so, we use the monitoring network to understand the contribution from industrial sources and reduce emissions. This task is in line with the Clean Air Agreement, which stipulates that an effort be made per target group to move towards WHO advisory values.’
Predicting air quality
This source-specific approach will be further expanded in the coming period, Henri van der Velden explains. ‘We’ve already used the Air Monitoring Network to substantiate the fireworks ban. Now, we’re looking at wood-burning with residents. How big is that actual impact and what can you do about it? We’re also looking critically at air quality in vulnerable areas, for example around schools. We've measured in emergencies, such as major fires. You can't take action on that, but it does give insight into the consequences.’
Ultimately, Henri van der Velden also wants to be able to use the Air Monitoring Network more dynamically by making air quality predictable. ‘Like weather forecasting, you can advise residents to adjust their behaviour, e/g/ use public transport to get to work.’
According to Henri van der Velden, it’s about having an informed public discussion about measures that effectively contribute to our health. ‘And,’ he stresses, ‘that we all start to feel a shared responsibility for healthy air. I hope to increase that awareness among the general public with our Air Monitoring Network.’
Do you want to improve air quality in your region? At TNO, we’re happy to help you. Contact us for a free initial consultation.
Contact us
-
Fred Hartendorf
Functie:Business developer Circular economy and environmentFred is a driven, enthusiastic and open-minded business developer with a proven track record in both industry and government. The goal of his work is to create a healthier living environment by improving the air quality around us.
-
Standplaats:Utrecht - Princetonlaan
-
Email:Email Fred
-
LinkedIn:Fred on LinkedIn
-
-
Ruben Goudriaan
Functie:Project manager-
Standplaats:Utrecht - Princetonlaan
-
Email:Email Ruben
-
Get inspired
eDNA

Environmental DNA: TNO charts a new course for biodiversity monitoring

An innovative view on particulate matter
Tracking sources of greenhouse gases with satellites
This is our time: Eleonie van Schreven’s work on small satellites with a big impact
