Dutch municipalities exceed particulate matter guideline up to 90 days/year
The Guardian newspaper recently published an overview of average air quality in Europe. It showed the annual average exposure to particulate matter (PM2.5) over the period 2000-2019. Today, TNO has published a map showing the number of times a year that WHO’s daily average air quality guideline for particulate matter was exceeded. This is available for every municipality in the Netherlands for 2022.
Interactive particulate matter map of Dutch municipalities
The interactive particulate matter map shows for each municipality the number of days on which the WHO daily average guideline for particulate matter was exceeded in 2022. All Dutch municipalities exceeded WHO recommendations of a maximum 15 µg/m3, sometimes on more than 90 days. The WHO recommends that this should not occur on more than 4 days a year.
Detailed daily information is crucial: long-term exposure to poor-quality air causes lung and heart disease over time, but for vulnerable groups, peak load, which is by no means always reflected in annual averages, can lead to all kinds of health complaints, possible hospitalisations, and, in the worst cases, even heart failure that causes fatalities.
The European Environment Agency (EEA) has calculated that almost 240,000 people in Europe died prematurely from polluted air in 2020. The Health Council of the Netherlands stated in 2018 that exposure to particulate matter is responsible for about 4% of the burden of disease in the Netherlands (in Dutch).
Healthy Air Approach
Granular local data on particulate matter concentrations are essential, so that we can combine them with other data such as population density and the times and source of the pollution, in order to select the most effective and targeted approach to improve air quality in the localities concerned. We call this the Healthy Air Approach. Initial experience with this approach has already been gained in Eindhoven and surrounding area.
About TOPAS
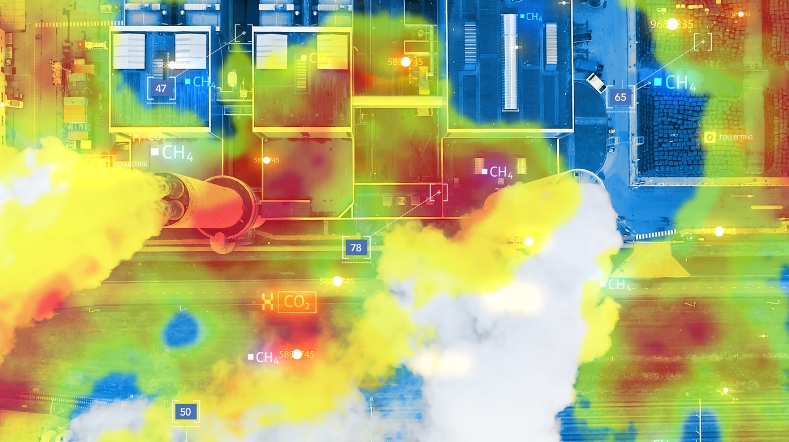
The data used by TNO comes from TNO’s online tool, TOPAS. In that tool, modelling of data from measurement points in the Netherlands and Europe for the previous few days shows how much particulate matter (both PM2.5 and PM 10) there was locally, as well as the source type and country of origin.
The prototype source apportionment service TOPAS is a product based on LOTOS-EUROS and emission knowledge developed at TNO. Information on intercontinental transport and forest fire emissions comes from the Copernicus Atmospheric Monitoring Service. Modelled source-specific PM concentrations representing urban background conditions are uploaded daily before noon.
Contact us
-

Bas Henzing
Functie:Business Developer nitrogenBas is a social business developer looking for the common good. Having been a researcher for 25 years, he now mainly directs climate and air quality research as a manager. You can contact him with any questions relating to nitrogen deposition. He has expertise in the scientific aspects and policy development within the nitrogen dossier.
We help national and international governments towards cleaner air and verifiable emission reduction strategies.
-
Standplaats:Utrecht - Princetonlaan
-
Email:Email Bas
-
Get inspired
eDNA

Environmental DNA: TNO charts a new course for biodiversity monitoring

An innovative view on particulate matter
Tracking sources of greenhouse gases with satellites
This is our time: Eleonie van Schreven’s work on small satellites with a big impact
