Knowing where a signal comes from: airborne eDNA meets wind modelling
Monitoring obligations under frameworks such as the EU Nature Restoration Law and the Kunming-Montreal Global Biodiversity Framework are growing faster than the measurement capacity to meet them. Airborne environmental DNA offers a scalable path forward, but only if it can answer one fundamental question: where does the signal actually come from? New research by TNO and Leiden University shows that wind data provides a reliable answer.
The gap between detection and location
Turning airborne eDNA into an operational monitoring tool requires more than confirming that a species' genetic material is present in the air. For the data to be useful to conservation managers, regulatory bodies, or biosecurity practitioners, it must be interpretable in spatial terms. A signal that cannot be traced to a likely source area is a biological observation, not a measurement.
This is where airborne eDNA has faced its most important technical constraint. Biological particles shed by animals, dispersed by wind, mixed by turbulence, and deposited across varying distances create a complex molecular signal. Previous research established that airborne eDNA can be detected reliably; what it could not yet say with confidence was whether a given signal represented an animal 30 metres away or 300 metres away. That uncertainty limits application in almost every domain where the technology matters most: spatial planning, habitat assessment, invasive species surveillance, and pathogen monitoring.
A controlled test in Rotterdam
To address this directly, a team from TNO and Leiden University's Institute of Environmental Sciences designed a field experiment at Rotterdam Zoo (Diergaarde Blijdorp), one of the Netherlands' largest zoological parks. The logic is methodologically sound: a zoo offers known species at known locations, making it possible to test whether a measurement model correctly predicts where a detection originates.
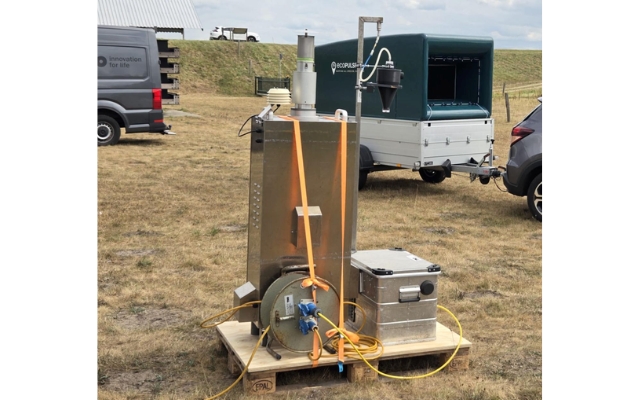
Over three weeks in spring 2024, passive airborne eDNA samplers were deployed at five locations across the 34-hectare site. Unlike active pump-based samplers, these devices move with the airstream and collect material only from the air that passes through them, making them well-suited to directional analysis. Samplers ran concurrently at each location and were retrieved after deployment periods of 6, 24, 48, 72, and 96 hours, yielding 75 samples in total. DNA was extracted and analysed using two genetic markers targeting vertebrate species, producing species lists for each sampler and each time window.
Wind data defines where signals come from
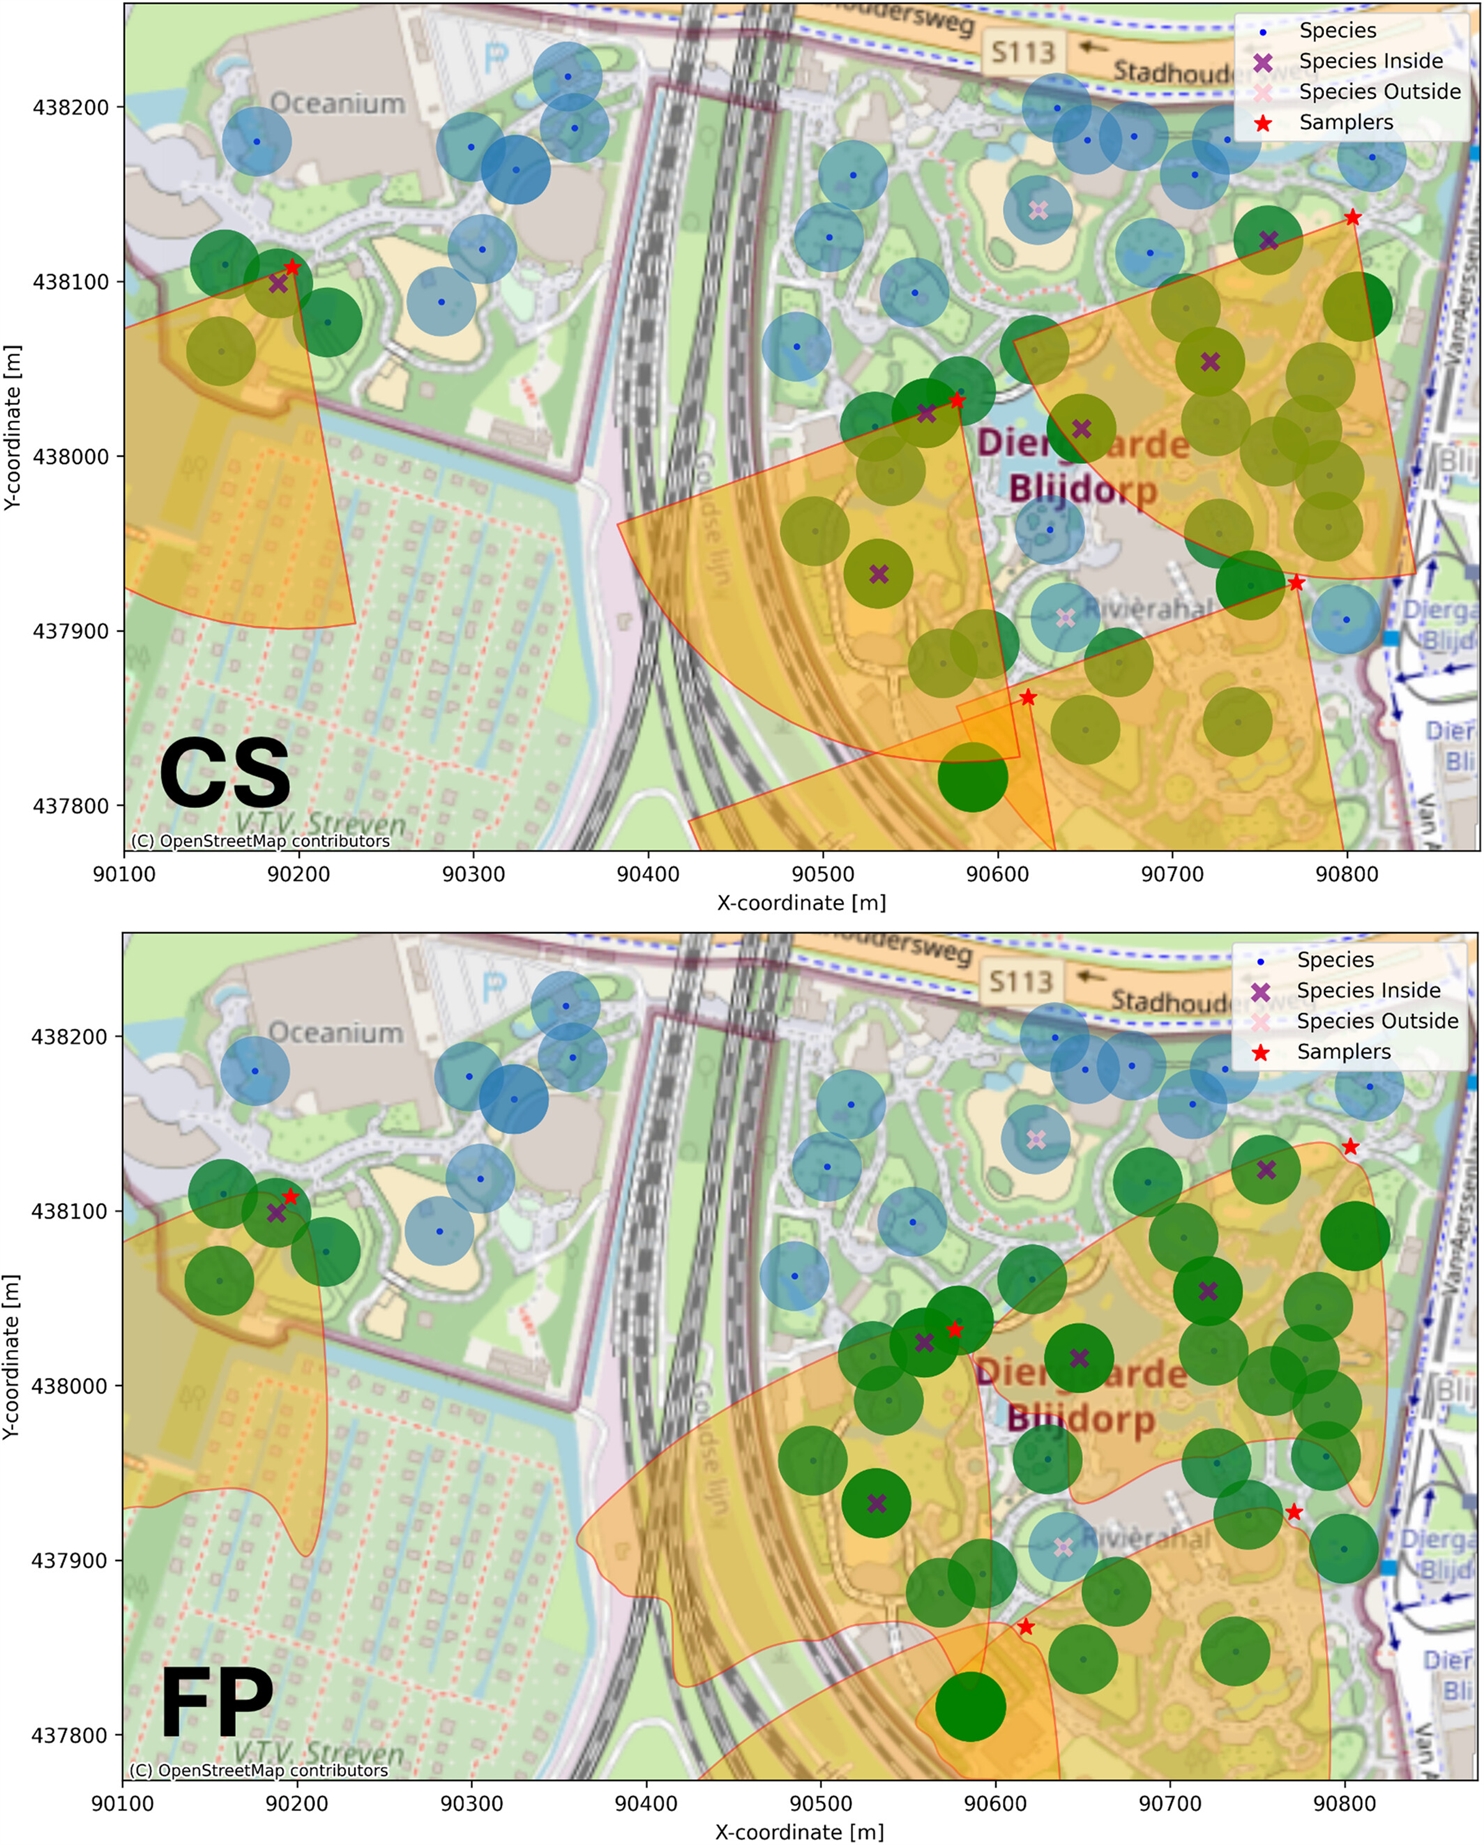
The research applied two models to estimate catchment areas: the geographic regions from which airborne eDNA could plausibly reach each sampler during its deployment period. The first, a Circular Sector model, used averaged wind speed and direction from a nearby KNMI weather station to calculate a sector-shaped zone upwind of each sampler. The second, a Footprint model, incorporated richer atmospheric data from the Copernicus ERA5 reanalysis dataset, accounting for terrain roughness, boundary layer dynamics, and directional variation in wind speed.
The results are consistent and practically significant. At distances up to 100 metres, every species detected via airborne eDNA fell within the predicted catchment area of the relevant sampler. At distances up to 200 metres, both models explained approximately 80 per cent of all detections. Beyond that range, the proportion of correctly predicted detections declined, likely reflecting contributions from alternative transport mechanisms such as turbulence around buildings, resuspension, or human movement within the zoo environment.
Across all measurement distances up to 655 metres, the overall accuracy of both models was 60 to 62 per cent. The detection ratio within modelled catchment areas was consistently six to seven times higher than the ratio outside them, confirming that wind direction and speed are the dominant drivers of local airborne eDNA transport.
Simple models perform as well as complex ones
One of the most operationally relevant findings is that the simpler Circular Sector model, which requires only standard weather station data, performed as well as the more data-intensive Footprint model. Adding micrometeorological complexity did not improve prediction accuracy at local scales.
This matters for deployment. Weather stations are distributed across the Netherlands and across Europe. The infrastructure needed to generate credible catchment area estimates for airborne eDNA monitoring is already in place. There is no requirement for dedicated on-site instrumentation, which substantially reduces the cost and logistical complexity of scaling the method to operational monitoring programmes.
Sampling duration also proved significant. Each doubling of deployment time increased the probability of a species detection falling within its predicted catchment area by approximately 57 per cent. Samplers running for 48 to 72 hours produced the most stable results, offering practical guidance for standardising collection protocols in future monitoring applications.
Spatial interpretation as a measurement discipline
This research represents the direct application of TNO's expertise in atmospheric modelling and air quality science to the emerging field of biological monitoring. The same methodological rigour that underlies TNO's work on pollutant dispersion, source attribution, and network-based air quality monitoring has been brought to bear on the challenge of spatial interpretation in airborne eDNA.
The result is a validated, transferable framework. By combining passive sampler data with meteorological records, it is possible to define, with quantified confidence, the spatial footprint from which a given airborne eDNA measurement draws its signal. At short ranges below 200 metres, that confidence is high. At longer ranges, additional transport mechanisms introduce uncertainty that future research will need to characterise further, including seasonal variation in wind patterns, species-specific emission rates, and the role of particle size in atmospheric residence time.
The study was carried out as part of TNO's broader programme to develop airborne eDNA into a credible, interpretable measurement technology. It has been published in the peer-reviewed journal Environmental DNA (Stewart et al., 2026) and is openly accessible.
From research to application
The practical implications span multiple sectors. For nature conservation and regulatory reporting, the ability to attribute an airborne eDNA signal to a source area within approximately 100 to 200 metres downwind opens up genuinely new monitoring possibilities: continuous, non-invasive detection of protected or invasive species across landscapes that conventional survey methods cannot efficiently cover.
For agricultural applications, the same spatial framework could support early detection of plant pathogens or pest species, where the direction and proximity of an airborne signal determines the urgency and target of a management response. For biosecurity and public health applications, wind-informed catchment modelling provides the spatial grounding needed to move airborne eDNA from an experimental technique to a decision-relevant sensor.
The next steps include testing the models across seasons, extending the analysis to longer detection ranges, and building datasets on eDNA emission rates and particle behaviour that will improve model accuracy. TNO is actively developing partnerships with environmental monitoring agencies, consultancies, and sector organisations to bring this capability into operational use.
More information
If you are working on biodiversity reporting obligations, developing biological monitoring services, or exploring airborne eDNA as a tool for agricultural or public health surveillance, TNO welcomes the conversation. Contact our airborne eDNA team to discuss how spatial modelling can make your monitoring data interpretable and decision-ready.
Contact us
-

Fred Hartendorf
Functie:Business developer Circular economy and environmentFred is a driven, enthusiastic and open-minded business developer with a proven track record in both industry and government. The goal of his work is to create a healthier living environment by improving the air quality around us.
-
Standplaats:Utrecht - Princetonlaan
-
Email:Email Fred
-
LinkedIn:Fred on LinkedIn
-
Get inspired
International beyond Europe
eDNA
Report: 1st Dutch National eDNA Workshop

Environmental DNA: TNO charts a new course for biodiversity monitoring

An innovative view on particulate matter